Eastern Conference
East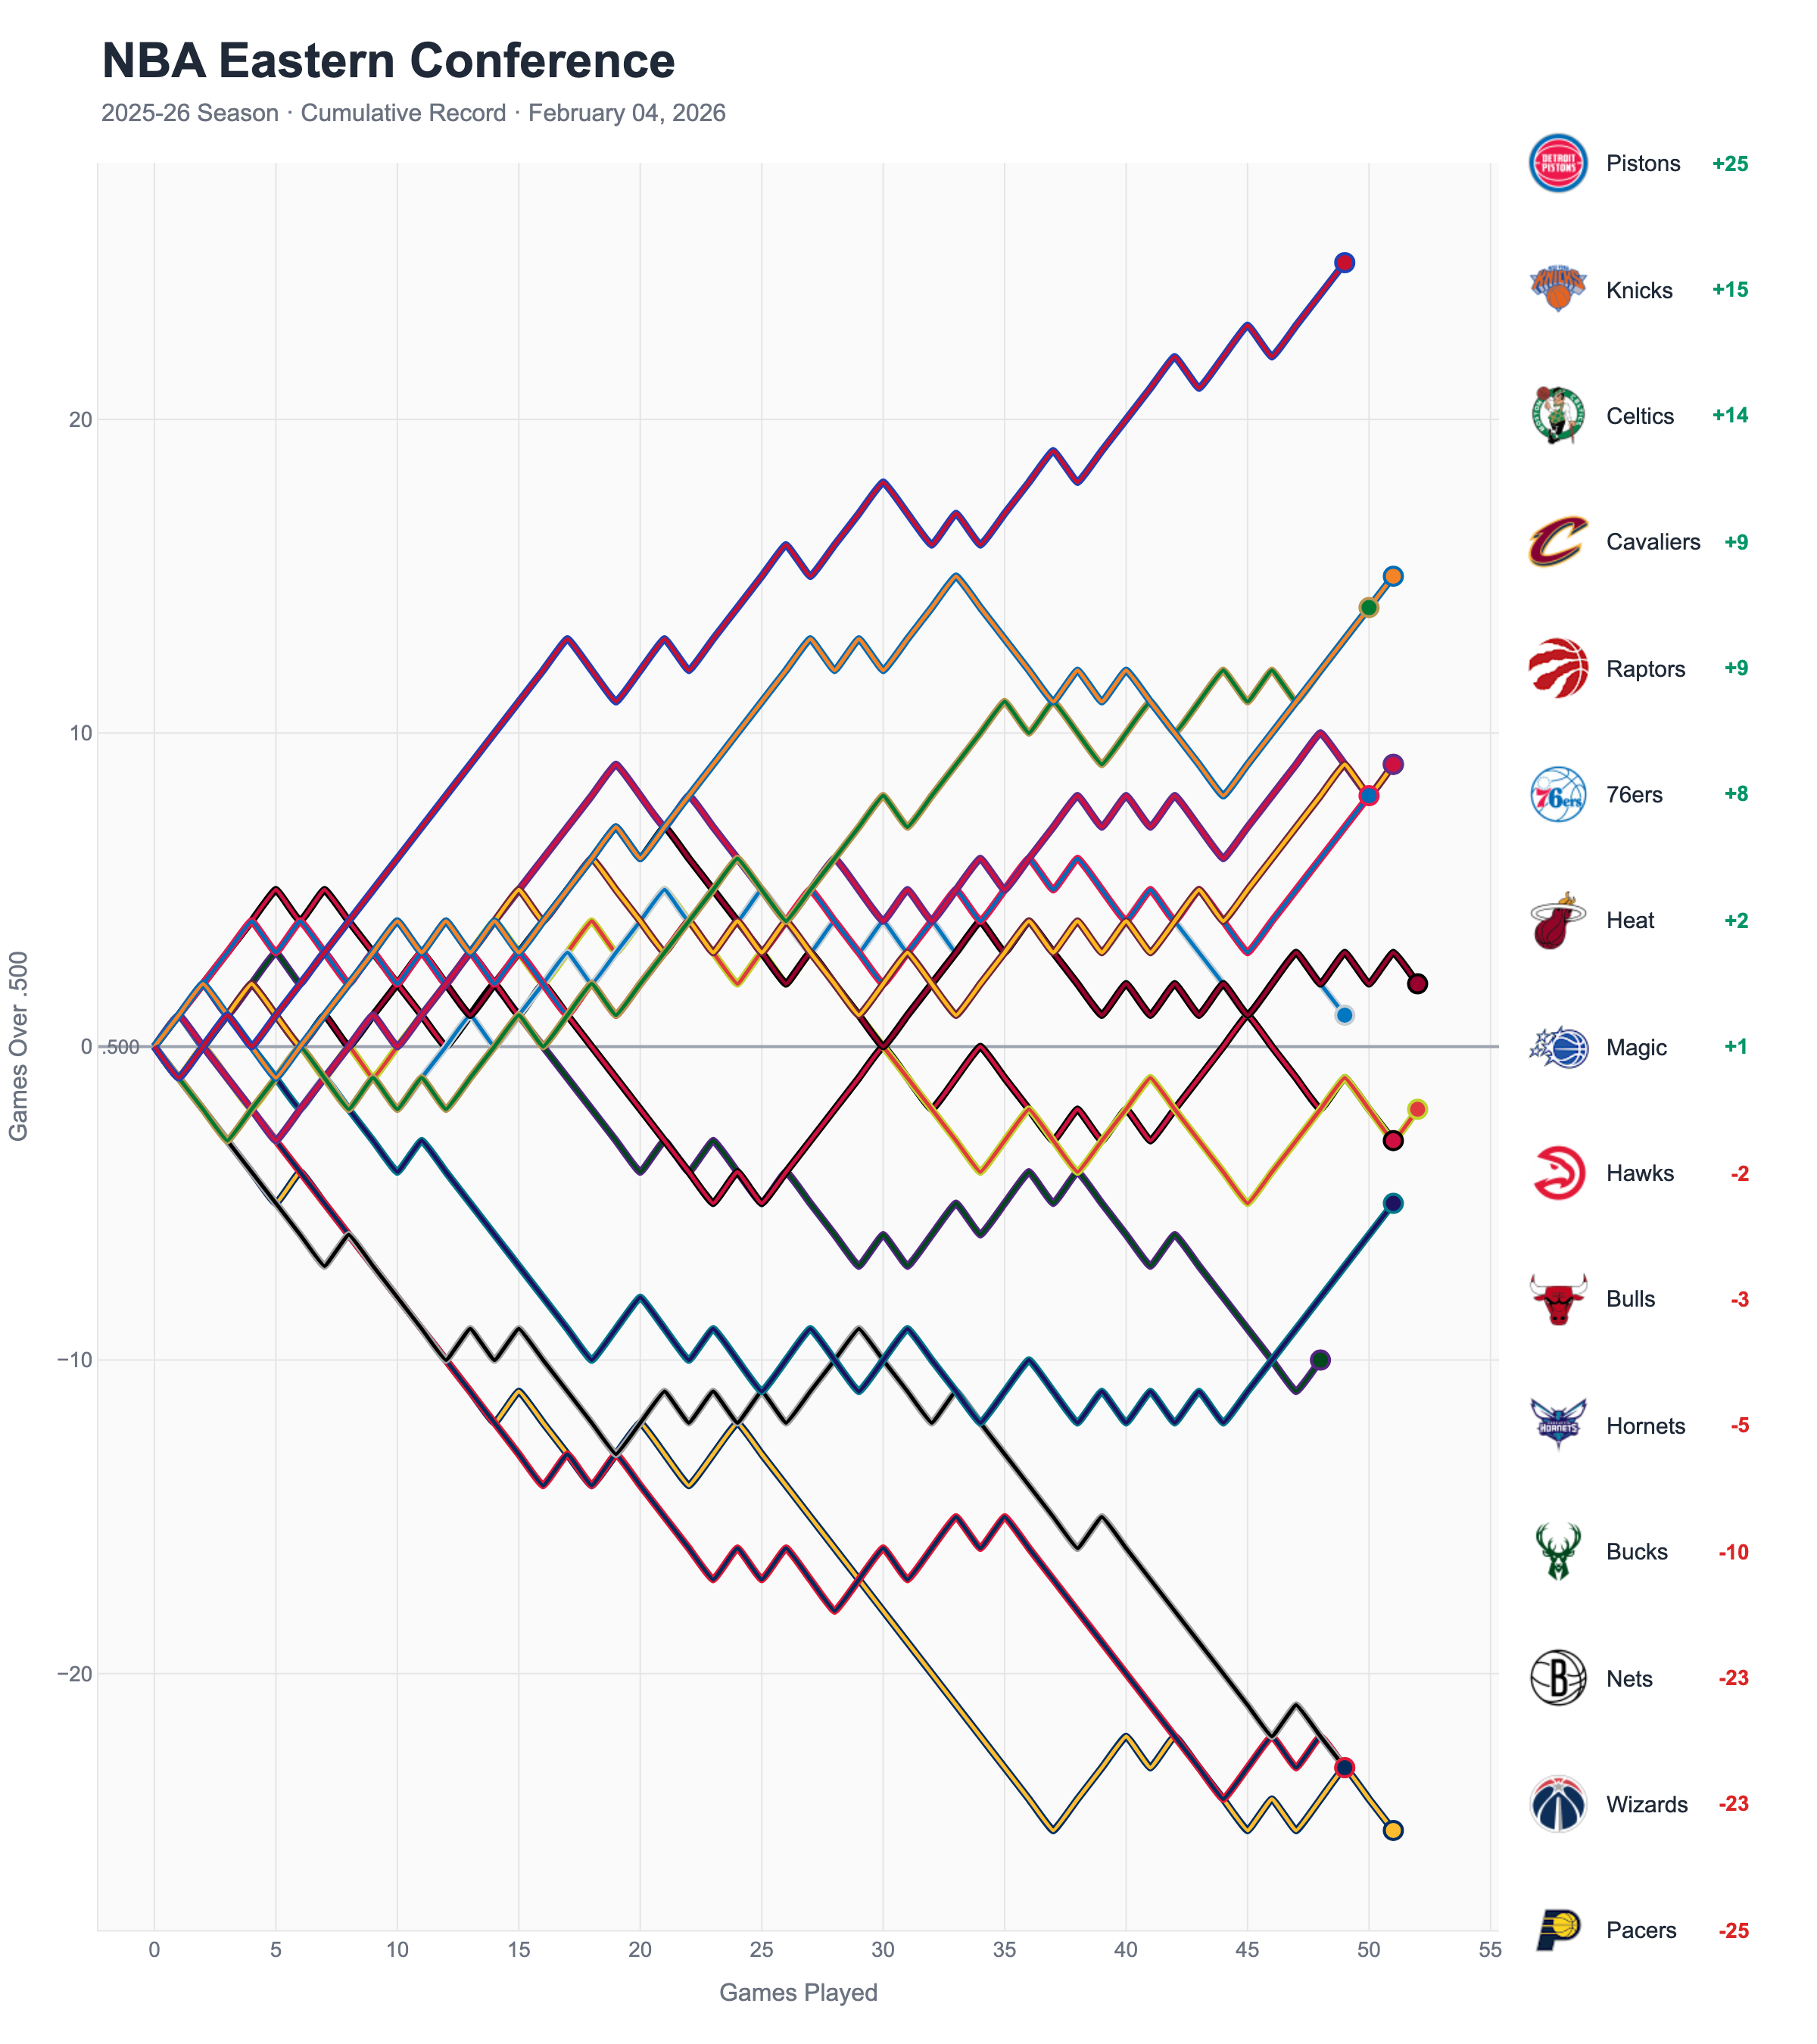
Games over .500 through ~54 games played
Simple NBA visualizations, updated weekly.
Games over .500 through ~54 games played
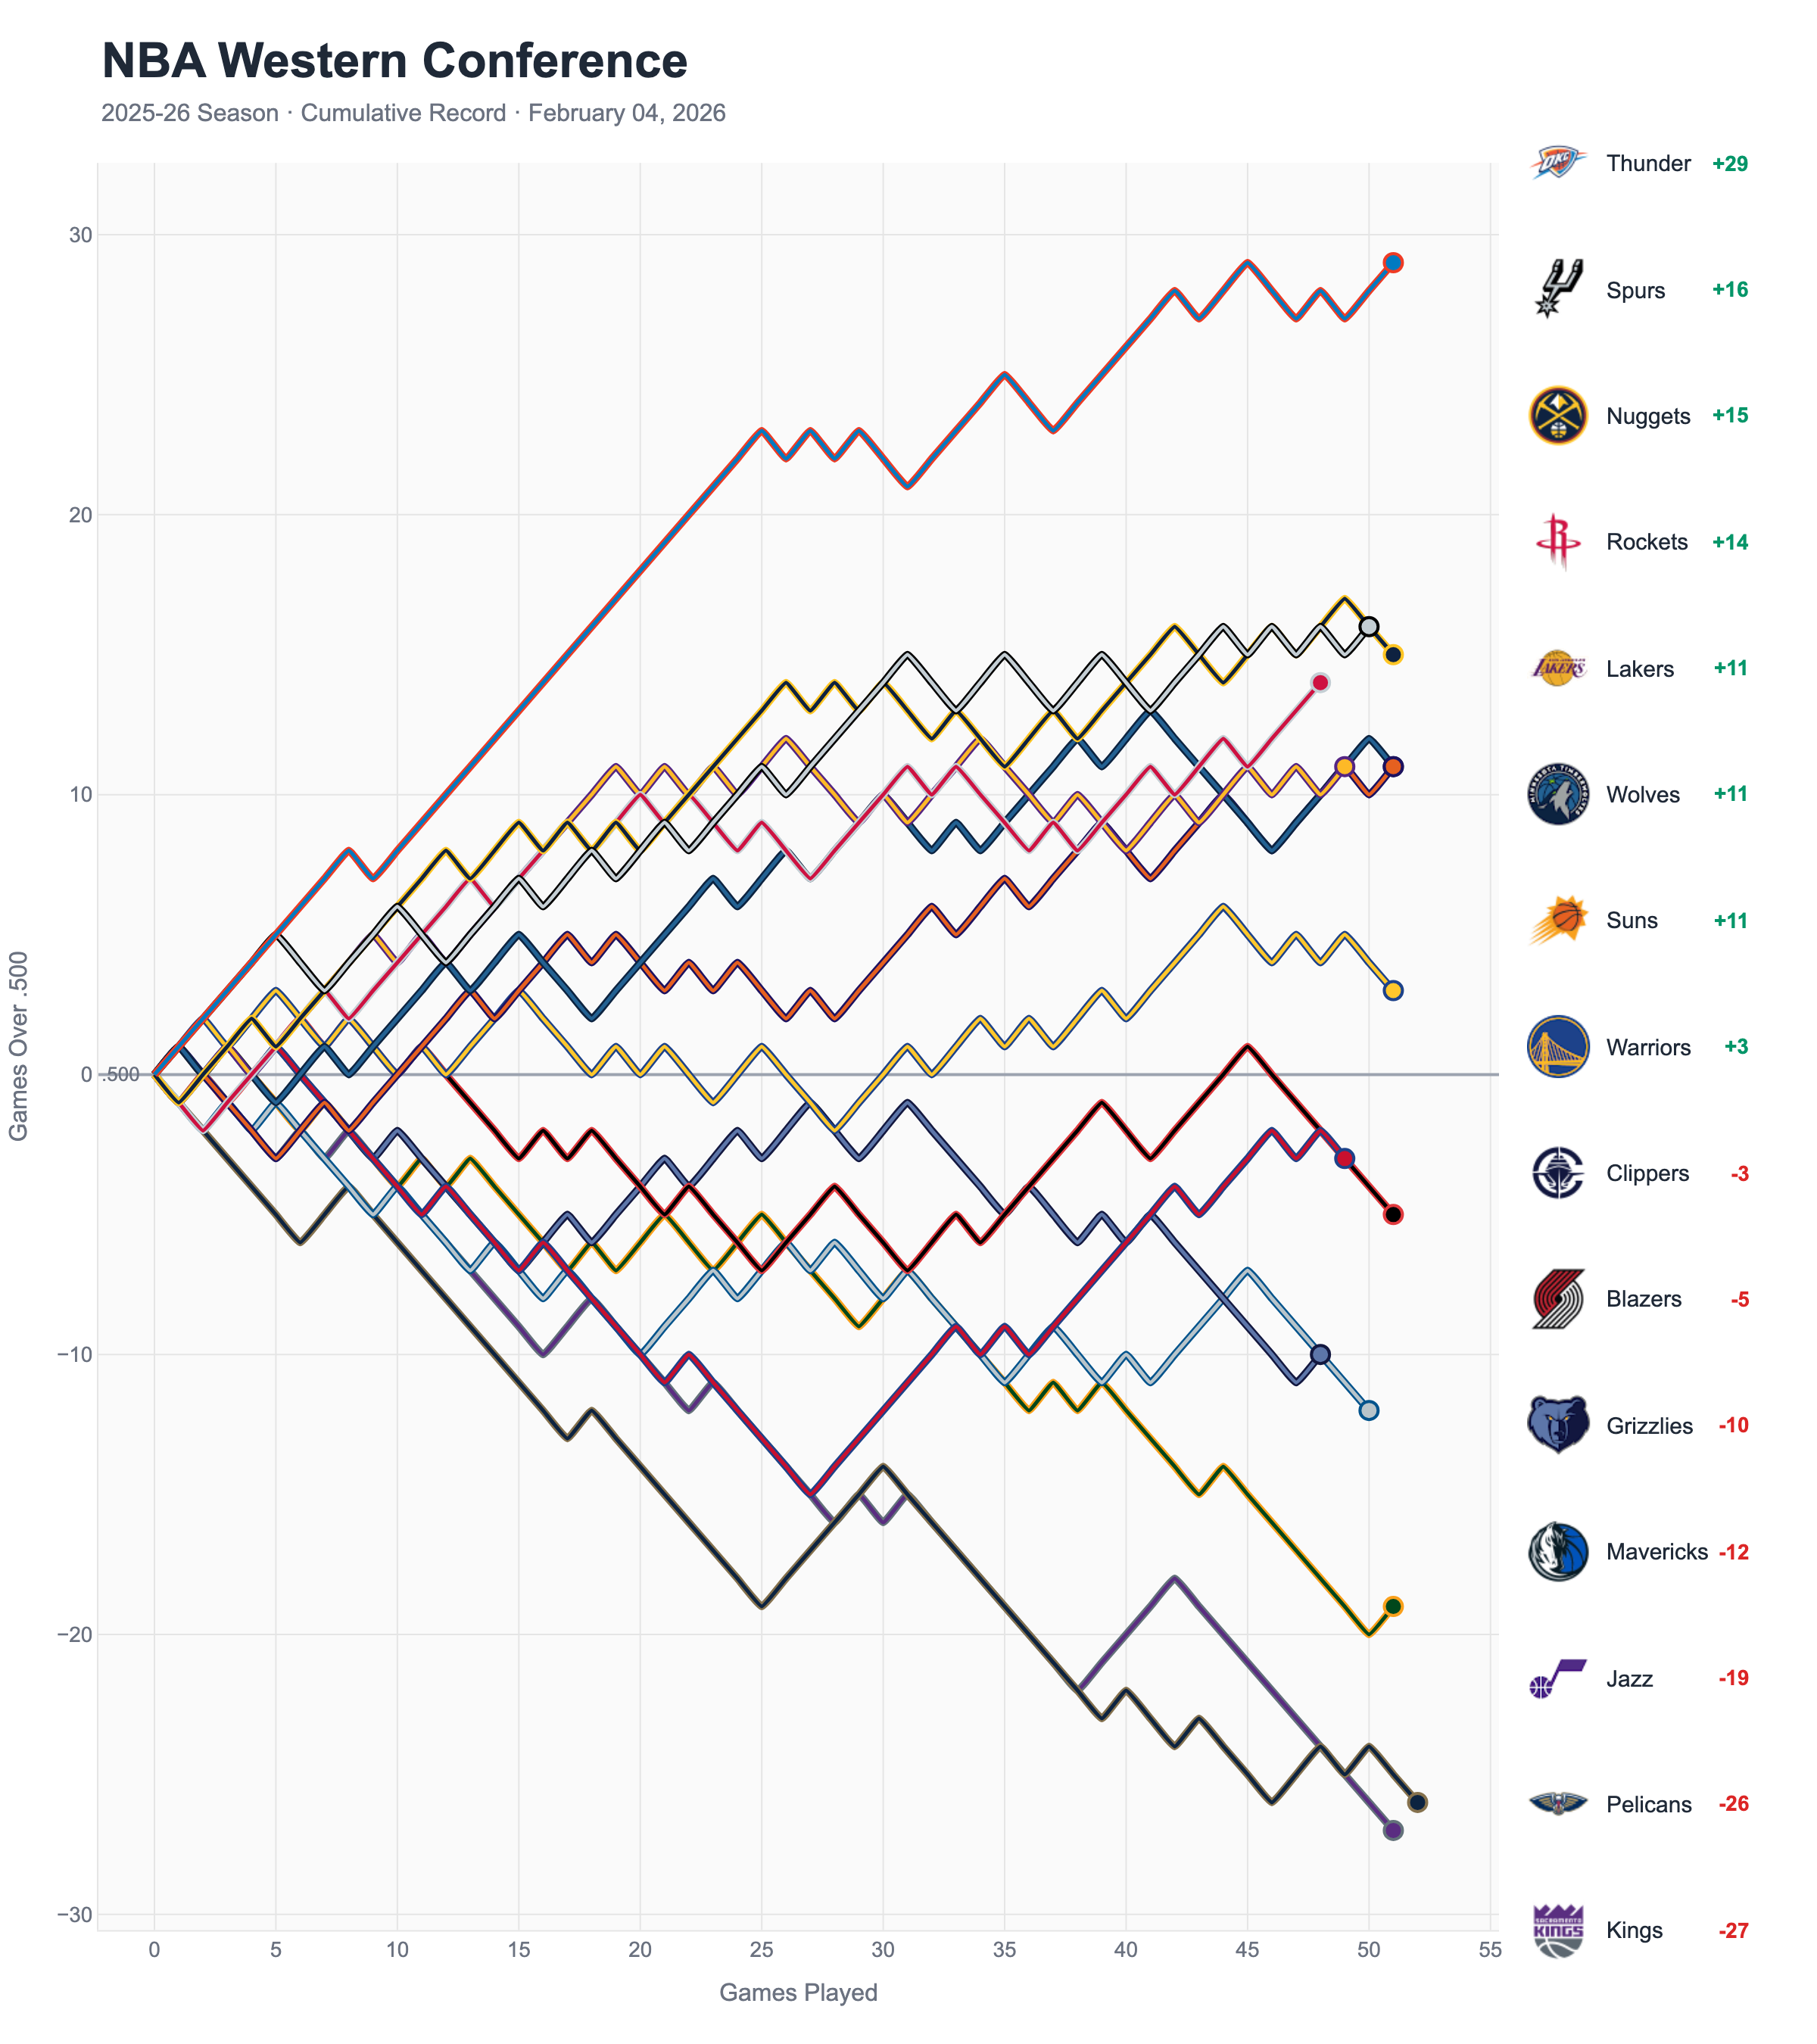
Games over .500 through ~54 games played
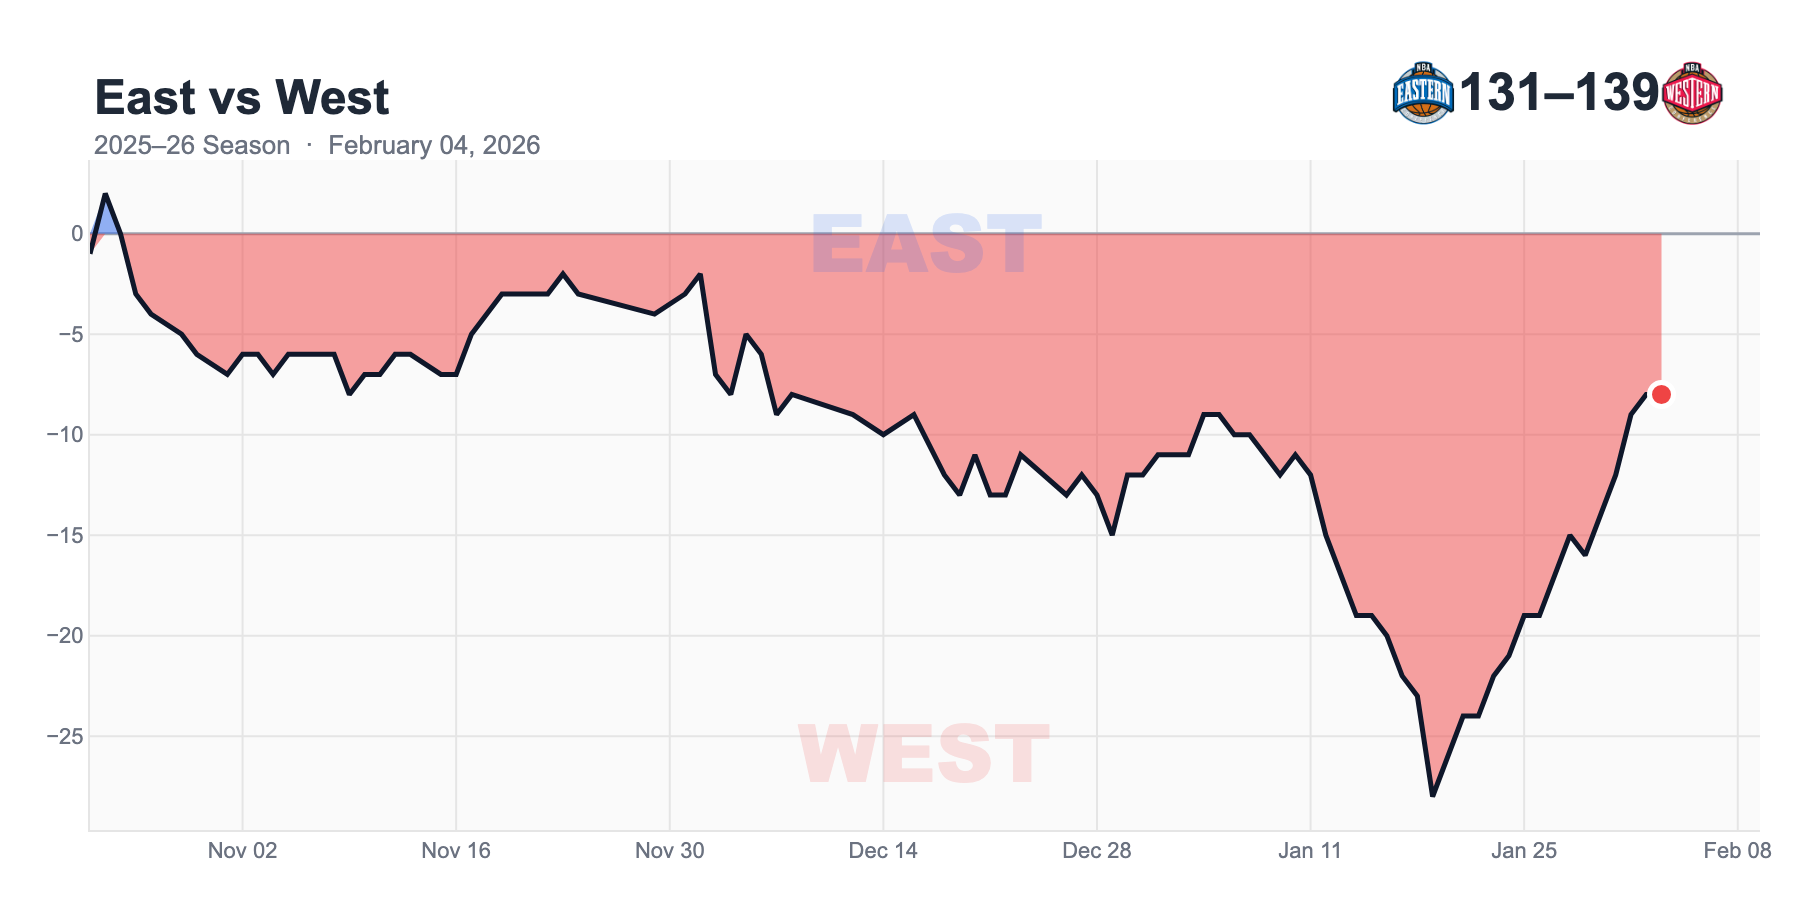
Cumulative inter-conference record
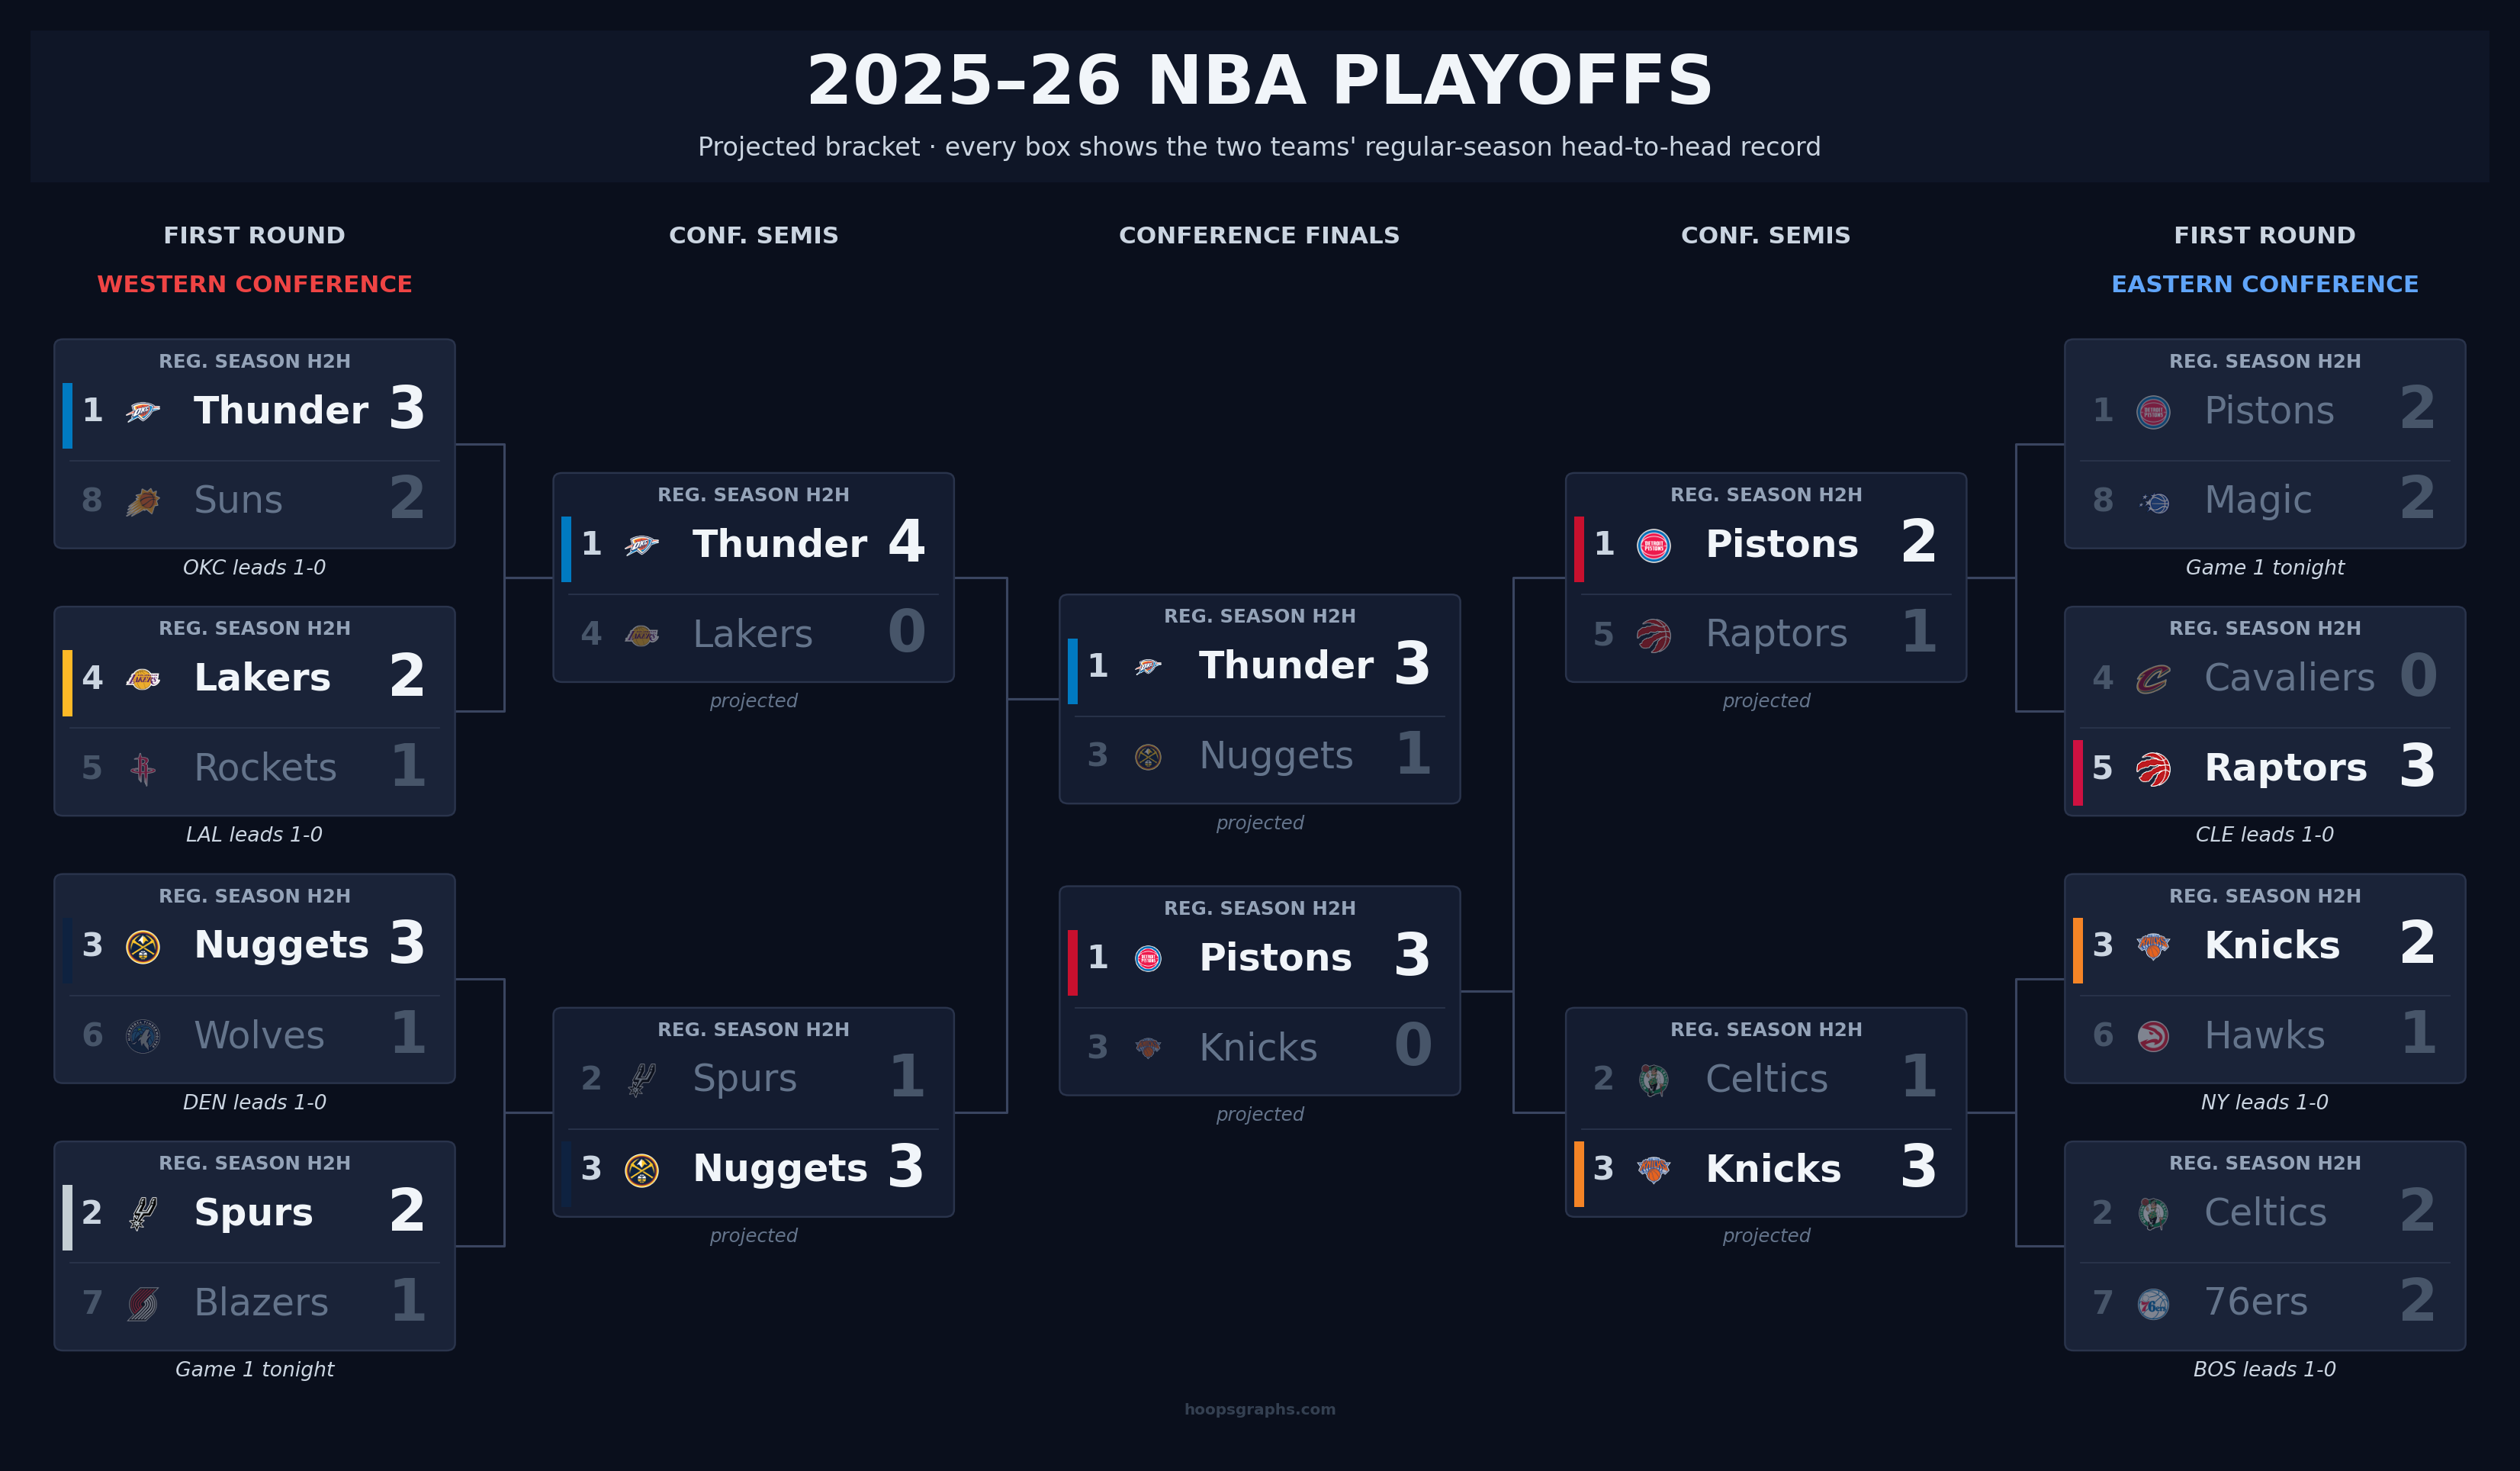
Every matchup shows the two teams' regular-season head-to-head record. Rounds 2+ advance whichever team won the regular-season series.
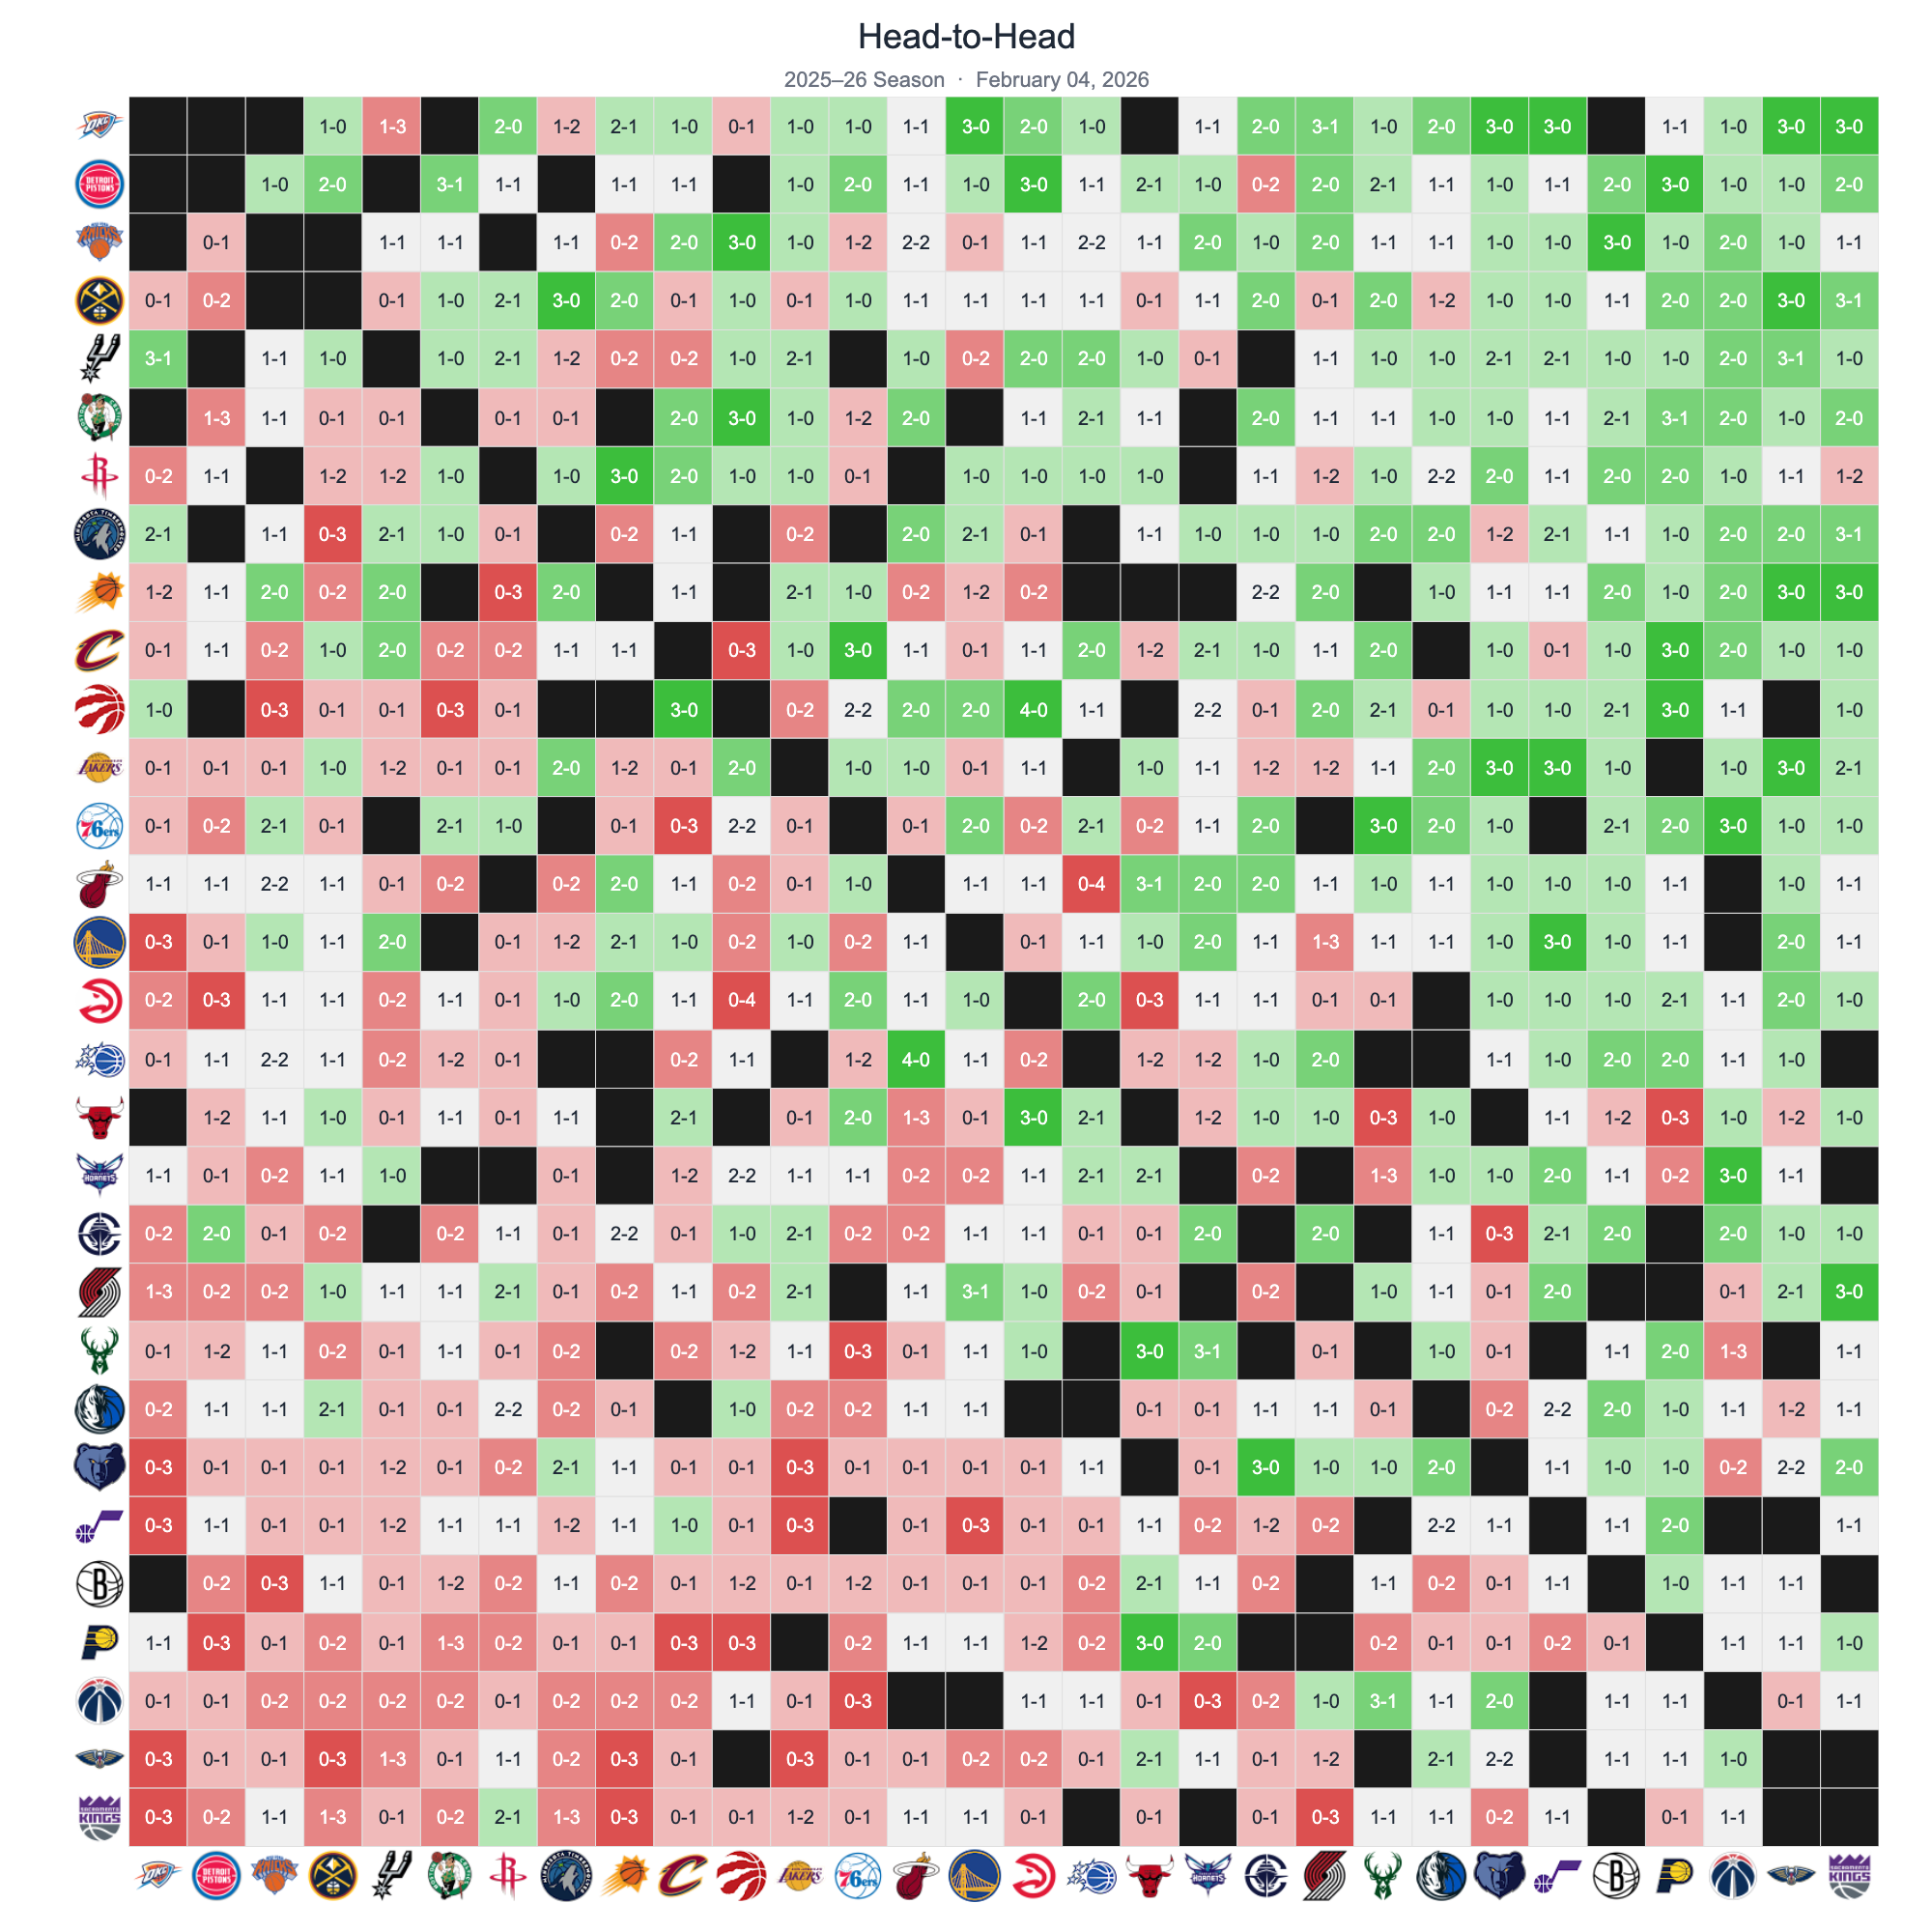
Every team vs every team
Every box on our NBA playoff bracket shows the two teams' regular-season head-to-head record — for example, if Team A won the regular-season series 3-1, that is the number displayed. For rounds that haven't been played yet, we project the bracket forward by advancing whichever team won the regular-season series.
NBA standings are highly dynamic, especially early in the season when a few wins or losses can dramatically shift a team's position. As the 82-game season progresses, standings tend to stabilize as sample sizes grow. These graphs capture that evolution, showing which teams started hot, which improved mid-season, and which faded down the stretch.
Games over .500 is simply wins minus losses. A team with a 15-10 record is +5 (five games over .500), while a team at 8-12 is -4 (four games under .500). This metric makes it easy to compare teams regardless of how many games they've played.
We update all NBA graphs weekly, typically on Tuesdays. This cadence captures meaningful movement in the standings while keeping the archive manageable. Each week's snapshot is preserved so you can see how the season unfolded over time.
Our East vs West graph tracks this throughout the season by showing the cumulative inter-conference record. Check the graph to see which conference is currently winning the head-to-head battle.